Feb 27, 2019 Plastics In The Ocean
Posted at 12:31h
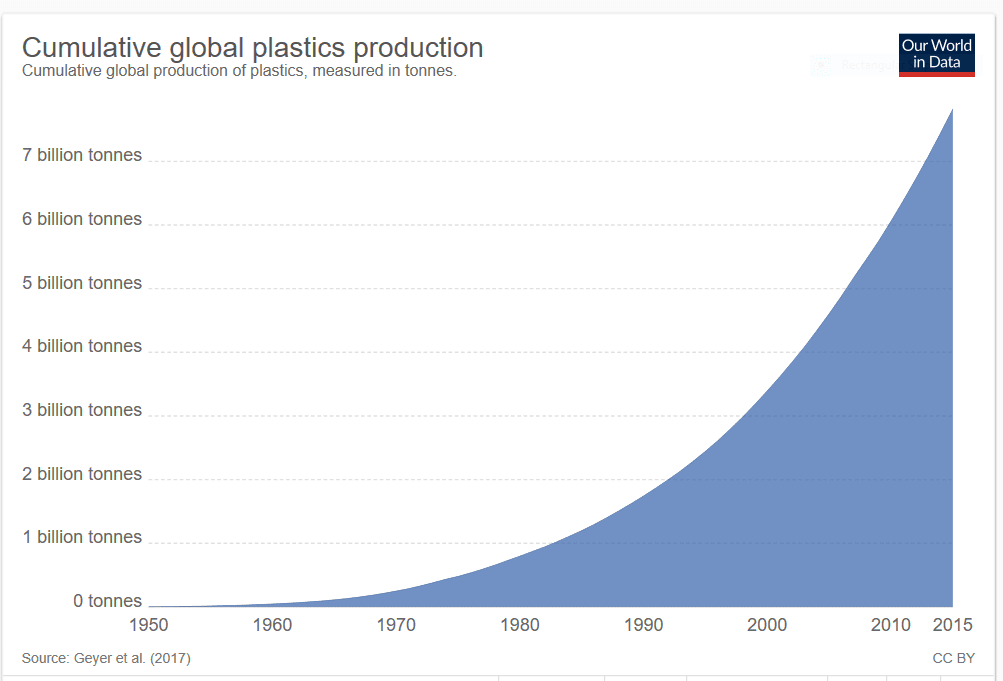
As the global production of plastic items explodes, plastic debris and waste are accumulating across the planet’s oceans. A 20-fold increase in plastic production occurred between 1964 and 2014, and the rate of production continues to increase (see figure: 407 million tonnes in 2015, 302 million tonnes of which ended up in the waste stream in 2015). Between them, China (60mt), the USA (38mt), Germany (14.5 mt), and Brazil (12 mt) account for 40% of this waste. An excellent update on this topic is provided by a new website – Our World in Data – produced by academics at Oxford University.
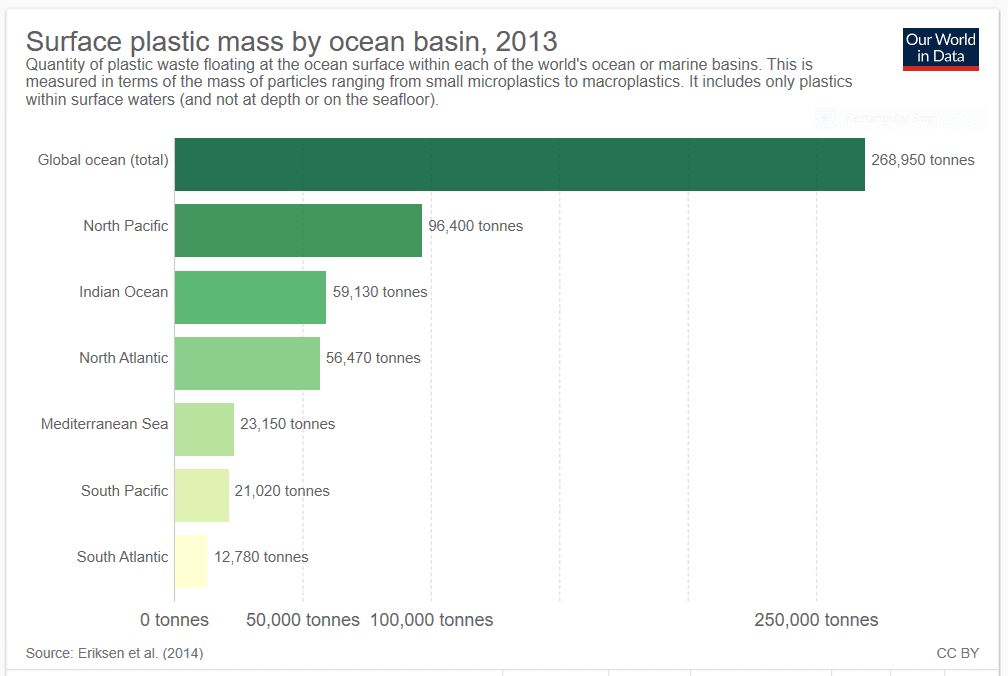
There has been a considerable focus in the past few years on the amount of plastic waste entering the oceans and the development of “plastic garbage patches” in the middle of the northern and southern Pacific, the northern and southern Atlantic, and the southern Indian oceans. These patches form when ocean gyres (ocean currents moving in opposite directions and, thus, creating a whirlpool effect with a “quiet” center) gather the debris deposited in the oceans from coastal land areas, rivers, and ships.

Data from Eriksen et al 2014 PloS One 9(12) e111913.
Sea turtles and many albatross species have become the indicator animals for the threats posed by this plastic waste (see Issue 1 of WellBeing News). Now, a recent paper by a research team from the UK, Turkey, the USA, and Australia (EM Duncan et al, 2019, Global Change Biology 25:744-752) reports that all 102 dead turtles they examined (30 from the Atlantic, 56 from the Mediterranean, and 16 from the Pacific) had micro-plastic particles in their gut. Turtles also consume macro-plastics (e.g. floating plastic bags that look like jellyfish in the water), and these may cause blockages that will lead to the death of the turtle.
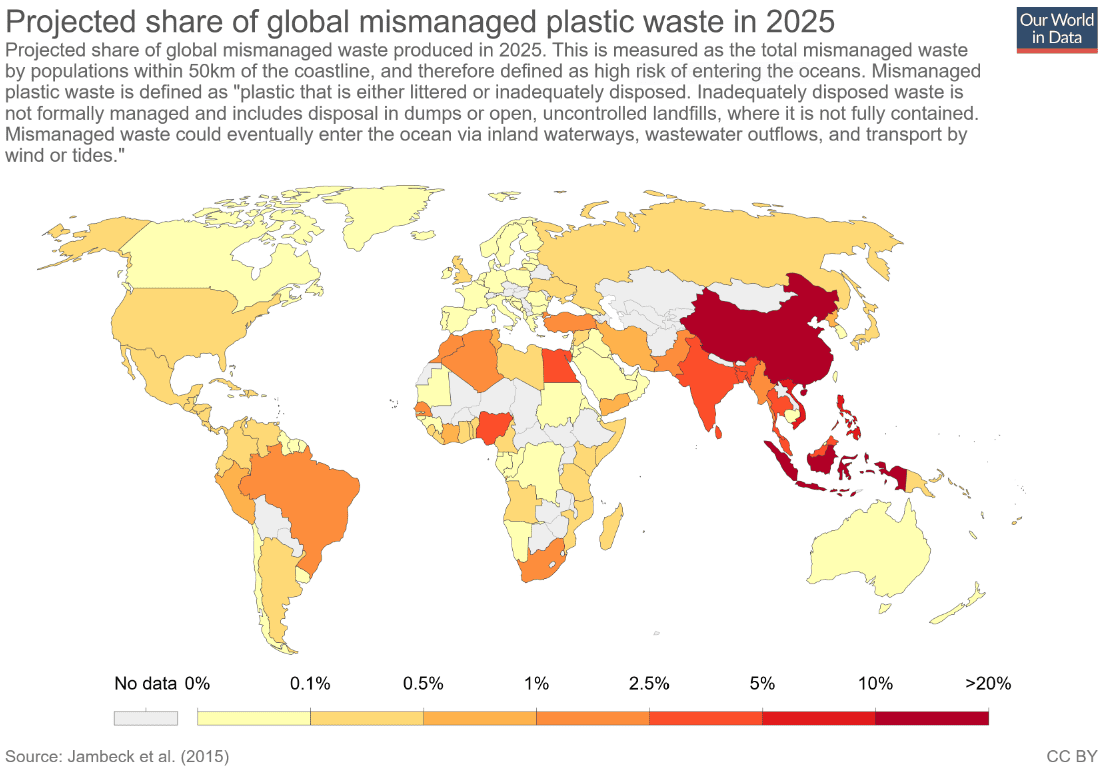
It is estimated that between 20-30% of ocean plastic wastes come from ships (e.g. discarded fishing tackle) and that the remainder comes from land sources. While Europe and North America are major producers and consumers of plastic products, these regions have well-managed waste streams and only a small percentage of their plastic waste ends up in the oceans. It is a very different story in developing countries. The Far East (including China, Indonesia, and the Philippines) is responsible for 60% of the plastic waste entering the oceans (which is why the Great Pacific Garbage Patch is such a major issue at the moment). South Asian countries are responsible for an additional 11% of ocean plastic waste, while Africa and the Middle East contribute another 17%. The remaining ocean plastic waste comes from the Americas (8%) and Europe and Central Asia (4%).

Data from Jambeck et al 2015
Plastic pollution has grabbed the world’s attention, and more and more organizations, including aquaria and large conservation NGOs, have begun focusing the general public’s attention on what they can personally do to reduce the problem of plastic! Better waste management in the Far East would have an immediate positive impact, but the world will still be left with a huge amount of macro- and micro-plastic waste in the oceans, and we have only a very limited idea of what its impact will be on marine life or on the humans who eat marine animals.
The three charts in this story are available (with many others) in interactive format at https://ourworldindata.org/plastic-pollution.


