Mar 30, 2021 World Happiness 2021
 The first World Happiness Report, drawing extensively on Gallup’s World Poll data, was published in 2012. The report is now released every year on March 20th and the 2021 World Happiness Report is the ninth in the series. The first eight reports were produced by a founding trio of co-editors who were assembled in Thimphu (the capital of Bhutan) in July 2011. The organizations who now write and produce the report every year include the Center for Sustainable Development at Columbia University, the Centre for Economic Performance at the London School of Economics, the Vancouver School of Economics at the University of British Columbia, the WellBeing Research Centre at Oxford University, and the Gallup Organization who conducts the annual world poll providing key data for the report.
Nobody will be surprised to learn that this year’s report looks at how the world is faring under the Covid-19 pandemic. The aim of this year’s report was two-fold – to look at the impact of the pandemic on the structure and quality of people’s lives and, second, to evaluate how governments have dealt with the pandemic.
There has been a surprising resilience in how people rated their lives overall during the pandemic. Generally, they rated their lives as positively as in 2019. This is not an artefact of the Gallup World Poll data. The Gallup findings are confirmed by other national and Eurobarometer surveys. The findings again confirm a strong link between trust in authorities and national institutions and overall well-being. Trust and the ability to count on others were important components of that resilience. However, the pandemic did result in an increase in negative emotions such as anxiety and stress.

In 2020, Gallup was forced by the pandemic to switch from face-to-face interviews, previously used for more than three-quarter of the countries surveyed, to telephone interviews. Many countries (around one-third) did not have completed survey responses in time for inclusion in the 2021 report. The change of interviewing mode does not appear to have produced substantial variances from previous years although the authors indicated that there was some chance that the change in survey mode may have affected the responses.
The report also looked at the factors that influenced the death rates from Covid in 2020. There were two sets of variables – the first reflecting demography, geography (e.g., being an island) and likely exposure to the virus from neighboring countries. The second set reflected social and economic differences between the different countries and were prior experience with the 2003 SARS epidemic, the level of trust in one’s government, having a female head of government (23 countries) and the Gini coefficient for income inequality. One of the most significant variables affecting higher death rates was the median age of a country’s population. For example, Europe’s average median age is 42 years but, in Sub-Saharan Africa, it is less than 20 years. It is therefore not surprising that Europe has experienced a much higher death rate than Africa. The seven variables together explained two-thirds of the international differences in death rates. As the data shows, those countries that successfully suppressed the virus had fewer deaths AND a better economy.
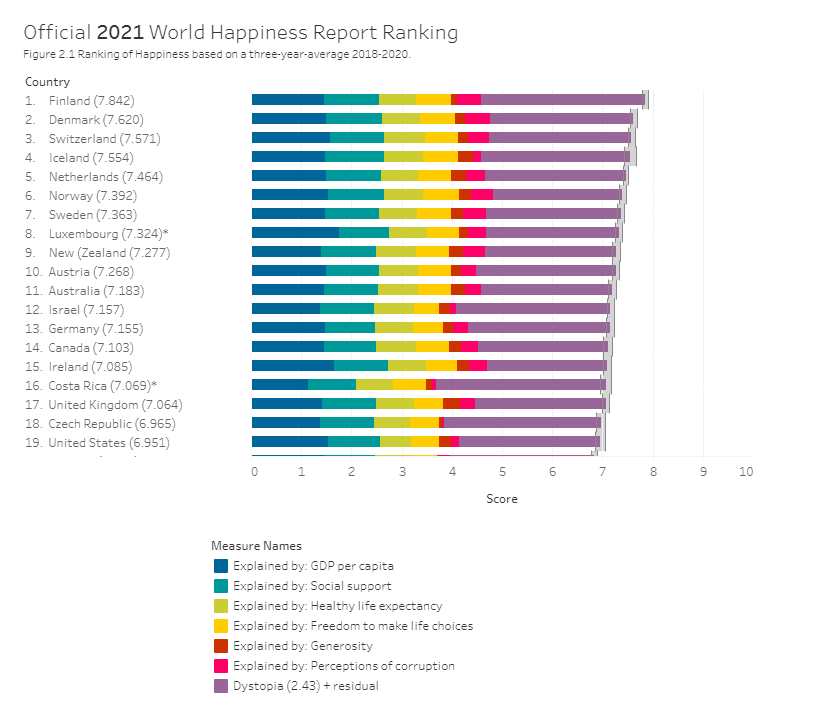
The final chapter of the 2021 report describes an approach to begin to evaluate the well-being impact of specific policies by using a new metric – the WELLBY (or well-being year). The WELLBY is based on the concept that people want to live well and they also want to live long lives. The WELLBY for a single individual is a measure of the well-being experienced by that individual each year summed up for all the future years the individual lives. Therefore, the measure of social welfare today is the average current well-being times the expectation of future years of life. This means that WELLBYs measure both societal wellbeing and national life expectancy. The countries at the top of the Happiness table also tend to be near the top in average life expectancy so the countries at the top of the WELLBY table are Finland, Switzerland, Iceland, Denmark and Norway. In the Happiness rankings, the order is Finland, Iceland, Denmark, Switzerland and the Netherlands. This approach is similar, but not the same as, the WALY (Well-being Adjusted Life Years) metric which has been developed to evaluate the impact of health and disease on well-being. The developers of the WALY report that depression and anxiety are responsible for far greater reductions in well-being than any of the other illnesses considered.
We look forward to continuing development and application of measures of well-being and happiness in the coming decade and to a re-evaluation (and reduction?) of consumption in an effort to increase well-being.


