Dec 05, 2023 Where is the Evidence that Laboratory Animal Use is Falling?
In 1995, the Tufts Center for Animals and Public Policy released a report that claimed, inter alia, that laboratory animal use in the USA had declined by 50% since its peak in the 1970s. Several animal activists criticized this claim. However, various data sets indicate that laboratory animal use in the developed world likely peaked sometime in the 1960s and 1970s and has since declined by 70% or more despite a brief plateau in animal use following the development of technologies in the early 1990s that permitted the creation of mice with specific genetic modifications.
There were expectations that the use of genetically engineered mice mimicking specific human conditions and diseases would lead to new therapies. However, the results of the genetically modified mouse revolution have been disappointing. The latest technology that is exciting researchers is the development of microphysiological systems. These systems use human stem cells to create differentiated human organoids – human cell aggregates that mimic the structure and functions of organs such as the human liver, kidney, and brain. In addition, artificial intelligence is being deployed successfully to use large data sets derived from existing reports and the new microphysiological systems to deliver new insights on the safety of thousands of chemicals without relying on new animal studies.
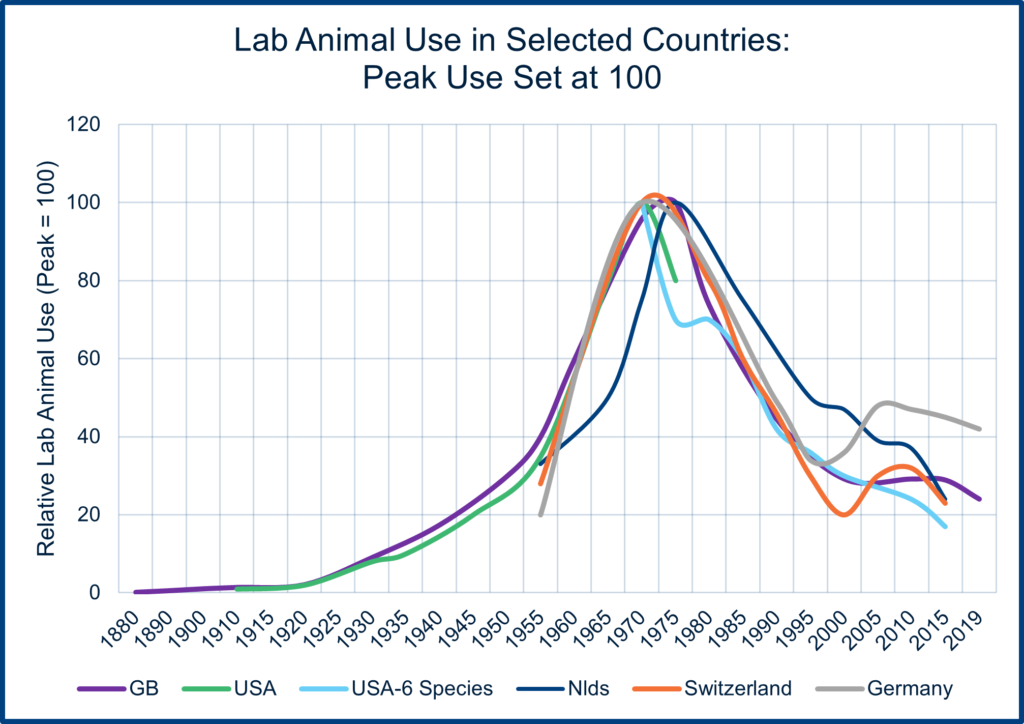
The chart below tracks the use of laboratory animals in five countries – Great Britain, the USA, The Netherlands, Switzerland, and Germany. All five have substantial biomedical industries. The chart normalized animal use data where peak use is set at 100 (for the USA, peak use is estimated at 50 million animals, whereas in The Netherlands, it is estimated to be 1.7 million animals). Standardizing the plots allows one to identify the similarities in laboratory animal use trends across countries, and it is evident that lab animal use trends in the five countries have followed very similar trajectories. The data for Great Britain, the Netherlands, Switzerland, and Germany all identify the plateau or upward blip in laboratory animal use driven by genetically modified mice technologies. But the charts also indicate that that trend is over and laboratory animal use is again falling.
The data used to generate the chart comes from many different sources. Great Britain has the best data series, having reported laboratory animal use annually since the 1880s. However, Great Britain changed their reporting system in 1987 from reporting “experiments” to “procedures,” where procedures include breeding activities. This definitional change caused around a 20% increase in the animal numbers reported in 1987. Additional definitional changes occurred again in 2014. As a result, one must adjust overall numbers accordingly. The annual laboratory animal use data series began in the USA in 1978 when the Animal Welfare Act required the US Department of Agriculture (USDA) to report on laboratory animal use. However, the USDA reports never reported using rats and mice and focused mainly on just six groups of animals – dogs, cats, non-human primates, rabbits, hamsters, and guinea pigs. There were earlier surveys of laboratory animal use in the USA conducted by the Institute of Laboratory Animal Resources in the 1960s and early 1970s, and data from those surveys have been included to create the chart. The Netherlands and Swiss data come from government reports starting respectively in 1980 and 1990. Peak use for these two countries was assumed to occur in 1970 at 1.7 million animals for the Netherlands and 2.8 million animals for Switzerland (where three major pharmaceutical firms were head-quartered). In and around 1957, the International Council for Laboratory Animal Science (ICLAS – founded in 1956) conducted surveys of laboratory animal use in several countries and reported 560,000 animals in The Netherlands, 803,000 animals in Switzerland, and an estimated 1.25 million in Germany. Readers should be aware of the different data sources used to create the chart and not rely too much on the early estimates. Nevertheless, because the standardized charts for the different countries overlap so closely, it is likely that the overall chart provides a reasonably accurate picture of laboratory animal use trends in an industrialized country. There was too little data to include Japanese laboratory animal use in the chart, but anecdotal reports indicate similar trends in Japan. China and India are today significant users of laboratory animals, but their peak use likely occurred this century, so neither is likely to follow the use pattern shown in the chart.
It should also be noted that Canadian laboratory animal use figures do not follow the pattern shown in the chart. While annual rat and rabbit use in Canada has fallen steadily since the 1970s (overall by 70%), mouse use fell from 1.1 million in 1975 to 480,000 in 1997 and then increased again to around 1.4 million in the last few years. All laboratory animal use (including fish and birds) in Canada grew from 2.6 million in 1975 to 4.4 million in 2019.
In conclusion, the data indicates that, following a dramatic rise in animal use in the 1950s and 1960s, laboratory animal use in several developed countries has declined dramatically since the mid-1970s. The rapid declines observed in the chart were mainly due to shifting animal use patterns in commercial laboratories – specifically in drug discovery programs and quality control procedures. In the last decade, technological innovations (for example, developing techniques to use human stem cells in engineered micro-physiology systems) have led to a rapid switch from genetically modified mice models to systems using human cell culture. As a result, funding support for two major mouse breeding programs in Great Britain has been cut, leading to a drop in laboratory mouse use in that country.
In summary, tracking laboratory animal use over time is possible, but one must be aware of the many methodological challenges when establishing animal use trends.