Jul 10, 2019 Plastics by the Number
Posted at 12:12h
At the end of 2018, Great Britain’s Royal Statistical Society selected a “plastic fact” – that 90.5% of all plastics ever made have never been recycled – as its Statistic of the Year. This statistic is taken from a paper Roland Geyer and colleagues published in Science Advances in 2017 on plastic waste. They report that an estimated 6.3 billion metric tonnes of plastic has been thrown away and now persist in landfills, oceans and the environment! About 12% of the 8.3 billion metric tonnes of plastic produced since World War II has been incinerated and 9% has been recycled. Plastic waste is now so widespread that it has been proposed as an indicator of the beginning of the Anthropocene era when humans began to alter the world’s ecosystem significantly (other suggested dates for the beginning of the Anthropocene include the beginning of agriculture 12-15,000 years ago and the beginning of the nuclear age about 75 years ago).
There are a number of statistics about plastic waste in public media. A number that has been quoted widely is the huge amount of plastic entering the oceans from East Asia (see below). Eight of the ten main rivers washing plastic waste into the ocean are in East Asia.
Percentage of plastic waste entering the ocean from different regions of the world.
- East Asia – 60%
- South Asia, Middle East, Africa – 28%
- Latin America and the Caribbean – 7%
- Europe & North America – 5%
However, when one looks at the production of plastic goods and plastic waste, a somewhat different picture emerges (see table below – the numbers are for 2010 & 2015 and are taken from the website, Our World in Data – https://ourworldindata.org and from the 2017 article by Geyer et al). The amount of plastic that has entered the oceans is actually a relatively small percentage of the total and, with concerted global action, it should be possible to make a real difference and save the marine creatures that are dying because their stomachs are full of plastic.
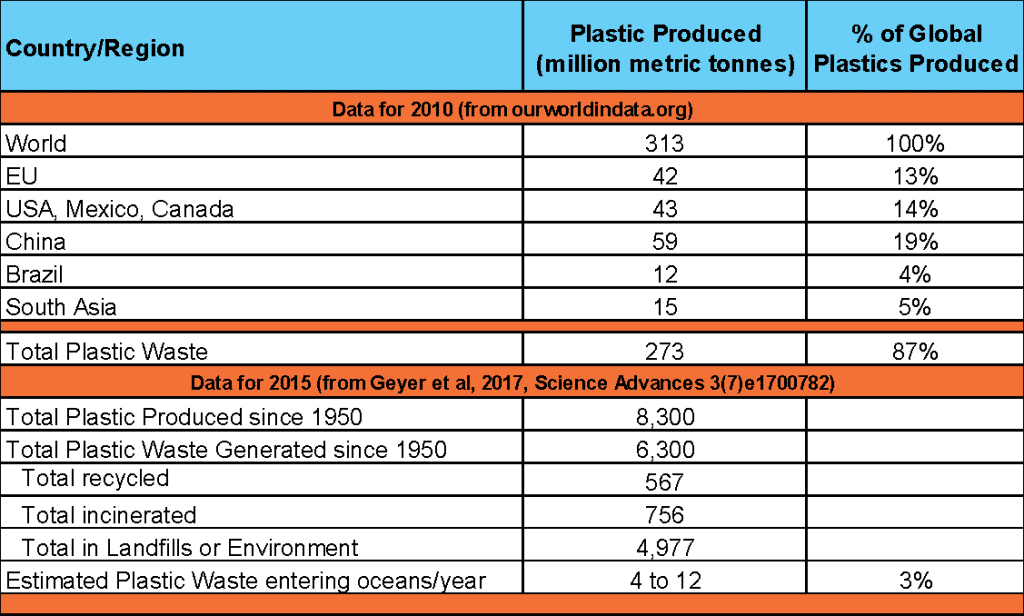
On a per capita basis, plastic production is highest in North America, Europe and Japan all of whom produce more than 100 kilograms of plastic per capita while China produces 72 kilograms. The next highest country or region produces 38 kilograms. Clearly, we should be worried about countries who are polluters of plastics but countries that are producers of plastics are of major concern as well. The amount of plastic produced annually has grown from 2 million tonnes in 1950 to 400 million tonnes today and the rate of production continues to increase. As for the total amount of plastic waste produced annually, just three regions (China, the EU and the NAFTA (US, Canada & Mexico) countries produced 52.5% of all plastic waste (143.4 million tons) in 2010.
While understanding the data is critical to help identify solutions to the plastics challenges, we must remember that individual actions can have a significant impact when expressed by enough people. Individuals can and should press their governments to support appropriate environmental actions and individuals can also influence corporations to adopt greener policies through their purchasing behaviours and investments in corporations. We should not forget the power of collective actions as expressed in the epigraph usually attributed to the anthropologist, Margaret Mead (but not found in her writings)- “Never doubt that a small group of committed citizens can change the world. Indeed, it is the only thing that ever has.”