
Jan 09, 2024 Pet Demographics: Evolving Numbers and Insights
In 1995, Anthrozoos (vol 8(4):199-205) included an editorial by Gary Patronek (then completing his Ph.D. on companion animal demographics at Purdue Veterinary School) and A. Rowan that discussed estimates of the pet dog and cat populations in the United States. G. Patronek reviewed the various pet dog and cat population surveys and discovered systematic differences between surveys conducted using telephone instead of pre-recruited household panels. The telephone surveys, conducted from 1985 through 1994 by Mediamark Research, reported pet dog prevalence, around 20% lower than those using household panel methods. At that time, the American Veterinary Medical Association (AVMA) and the American Pet Products Association (APPA) primarily used the household panel methods. We speculated in the editorial that the relative stability of the households in the recruited panels likely caused the systematic difference between the different survey methods. The participating households in the panel must have been in place for at least twelve months before the survey. This requirement might have resulted in a higher probability of acquiring a pet.
In 2008, during a panel organized to discuss the different estimates of pet dog and cat statistics in the US, a representative from the APPA commented that the AVMA survey probably provided the most accurate estimate of US pets. The biennial APPA surveys were conducted primarily to identify pet owners who agreed to complete a much longer questionnaire, which included information about their annual pet purchases, rather than to generate an estimate of US pet populations.
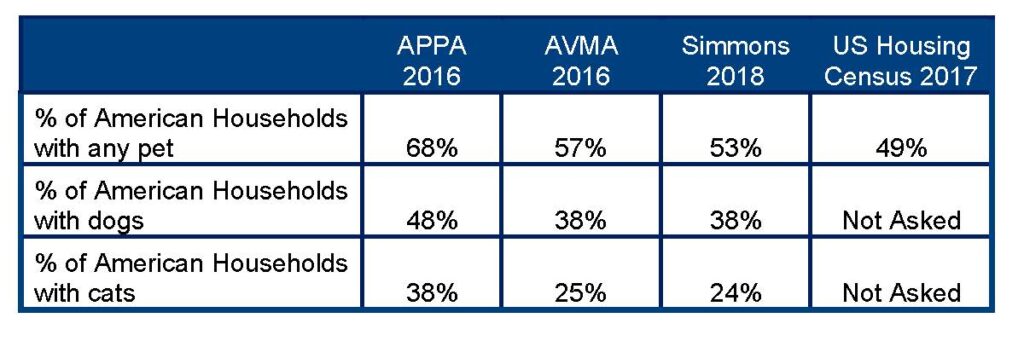
Twenty-four years later, Karen Brulliard and Scott Clement at the Washington Post authored an article, How Many Americans Have Pets? An Investigation of Fuzzy Statistics. The article included reported estimates of the percentage of American households that have different pets according to four different surveys (see table below).
The American Housing Survey conducted in 2017 by the US Census focused on twenty-five metropolitan areas in the USA and was not a national sample of households. However, the data from the American Housing Survey demonstrated that the percentage of households with pets varied inversely to human density in the metropolitan areas (see figure below).
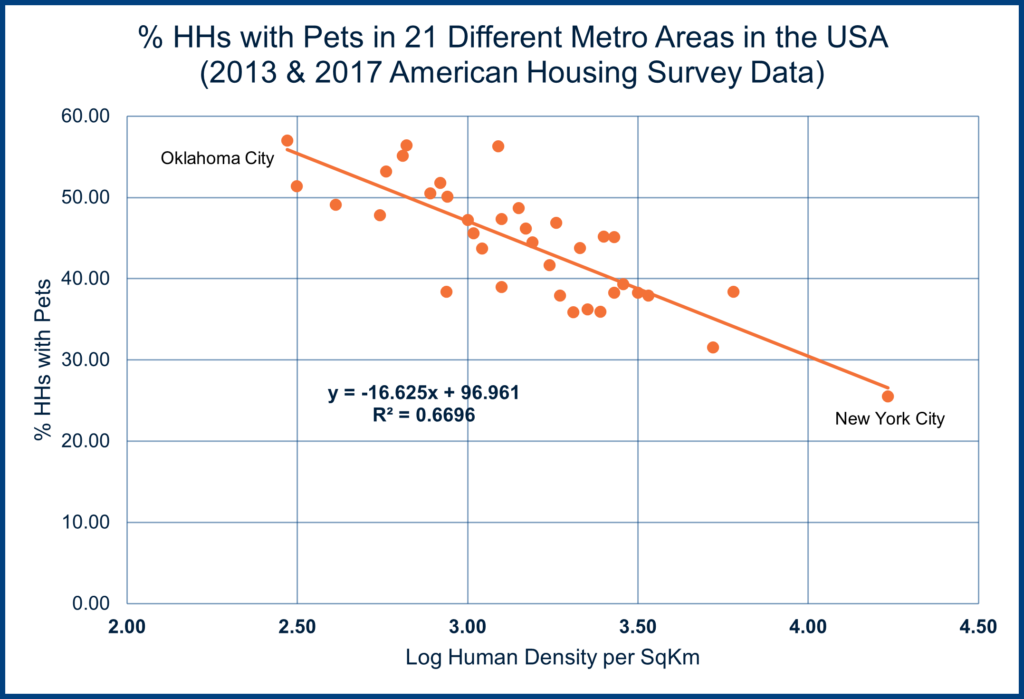
The data point on the right of the above graph is from New York City, where only 25% of households had pets. The data point on the left is from Oklahoma City, where 57% of households had a pet.
Surveys of dog demographics around the world (including Pakistan, Afghanistan, India, and Mauritius) also demonstrate a strong inverse relationship between relative dog numbers (dogs per 1,000 people) and human density. In India, there is sufficient data on dog populations now available to use human demographics (from national census data) to predict with some confidence how many dogs (both homed and street dogs) a particular city or community might have based simply on the human density of the community.
Surveyors have been employing online survey techniques for a number of years now. The data being generated indicate that online surveys systematically produce higher estimates of pet population compared to telephone and household panel methods. In the UK, when the pet food association shifted from face-2-face surveys to online surveys in 2020, their estimated relative pet dog and cat populations increased suddenly by more than 35% after being stable for the previous nine years. A switch to online surveys in the USA and Costa Rica also produced an unexplained (and likely false) sudden increase in estimated pet populations.
Data sources from Europe and the US indicate that the rate of pet keeping (e.g. dogs per 1,000 people) is relatively stable in any particular country. For example, in Sweden, the United Kingdom, and the US, the number of dogs per thousand people has been steady at around 80, 140, and 225, respectively, for the past fifty or more years in the three countries. Nobody has investigated why there is almost a 3-fold (and stable) difference in relative dog ownership in these countries. The rate of dog ownership in the US is among the highest in the world although both American continents have very high numbers of dogs (both owned and street) compared to the other continents.
There are public health (and animal sheltering?) implications stemming from the differences in pet ownership rates. For example, in the US, dog bites are around four times higher in rural communities than in urban centers. This difference becomes less puzzling when one learns that the number of pet dogs per 1,000 people in rural communities is approximately four times the rate observed in dense urban communities. There are also significant variations in the rate of pet cat ownership in the US from one state to another.
In the US, there have been several unsuccessful attempts to add a question on pet ownership to the national census. The decennial national census in the US asks questions about telephone, refrigerator, and television ownership by households but not about pets. The 2013 and 2017 American Housing Surveys asked questions about pet ownership to address disaster evacuation planning required by the 2006 PETS Act. Adding a national census question on pet ownership may be expensive, but the data generated would have important public health and community governance implications.
Given the growing importance of pets to households worldwide, it is surprising that the data on pet demographics in developed or developing countries is so variable.