
Oct 10, 2024 The Ongoing Challenge of Accurately Measuring Pet Ownership
In a 1973 article in the Bulletin of Atomic Scientists, Carl Djerassi, often referred to as the “father” of the birth control pill, and his colleagues argued that an effective method of animal birth control (the article was titled “Planned Parenthood for Pets”) was necessary for managing the pet population. For instance, in 1973, an estimated 13 million dogs and cats were euthanized in American animal shelters, despite there being only around 65 million pet dogs and cats in the country. Djerassi’s article further pointed out that, “[T]he first challenge faced by researchers studying the dog and cat population is the poor quality of numerical data, even in countries with advanced humane census efforts.”
Fifty years later, there are several regular surveys of pet ownership in America. These include surveys conducted by the American Veterinary Medical Association (AVMA) every five years since 1986, the American Pet Products Association (APPA) every two years since 1988, and the market research organization MRI-Simmons annually. However, there are significant differences in the estimated percentages of households with pets (ranging from 53% to 70% of households having any pet) between the surveys. It has never been clear why the different surveys produced different estimates of pet dog and cat ownership, but it is likely that Djerassi and his colleagues would be as disappointed in pet population data today as they were fifty years ago. In January 2019, the Washington Post ran an article on the varying estimates of the US pet population with the subtitle, “An Investigation of Fuzzy Statistics,” highlighting the ongoing challenges in accurately determining pet populations.
Several groups have petitioned the US Census Bureau to include a question about pet ownership in the decennial census, but none have been successful. However, after Hurricane Katrina in 2005, the US Congress passed the PETS Act of 2006, which among other provisions, required states and communities to include pets in their disaster plans. This led to a need for disaster planners to have an accurate idea of how many households in a community include pets. As a result, in 2013, 2017, and 2021, the US Census Bureau 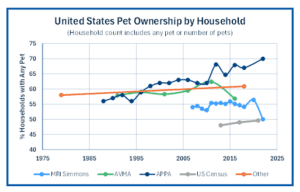 included a question on pets in the American Housing Survey. In 2013 and 2017, the question simply asked if a household had any pets without specifying the type of pets. In 2021, the survey also asked about the type of pet in the household. The results of the various surveys that report the percentage of households with any pet can be charted as shown in the chart, ‘United States Pet Ownership by Household’. Note: the y-axis is truncated and runs from 40% to 75%.
The US Census gathers information about pets from the American Housing Surveys conducted in major metropolitan areas across the country. These urban areas have high human population density. When comparing the 2013 and 2017 American Housing Survey data against log human density, it becomes evident that human density is a significant factor in pet ownership rates. The data shows that pet ownership decreases as human density increases; please refer to the ‘Percentage of United States Households with any Pets in Major Metro Areas’ chart. This suggests that households in major metropolitan areas are less likely to have pets compared to households in suburban and rural areas. This could be a reason why the US Census data on the percentage of pet-owning households is much lower than estimates from other surveys.
The method used to conduct pet ownership surveys can impact the results. In 1995, Gary Patronek and Andrew Rowan commented in an editorial in Anthrozoos that surveys using preselected household panels produced pet ownership estimates around 20% higher than surveys using Random Digit Dial methods. They speculated that the preselected households were more likely to have acquired at least one pet because panel households had to have lived in their homes for at least a year and were, therefore, probably more settled before being added to the panel. Random digit dial methods are no longer common, and online surveys are now widely used. It seems that online surveys produce higher estimates of pet ownership, although it is unclear why. Data on pet ownership in the United Kingdom (UK) has been collected annually by UK Pet Food since at least 2012. In 2020, due to the pandemic, UK Pet Food switched from face-to-face surveys to online surveys. The impact on the estimated pet ownership is illustrated in the chart, ‘United Kingdom – Percentage Household with any Pet.’
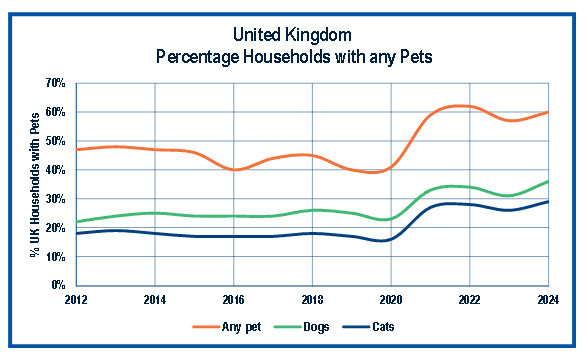 After switching survey methods, the reported pet ownership rates in the UK suddenly increased from around 40-50% of households with pets to around 60% of households with pets. This jump in pet ownership is likely not a real change, but rather a result of the change in survey methods. Similar increases in estimated pet numbers have been observed when surveys switch to online methods, but the clearest example is seen in the UK data.
It’s surprising that there is so little discussion, either in public or academic circles, about pet demographic data and the differences in estimates from different surveys. “You can’t manage what you can’t measure” is a quote commonly attributed to Peter Drucker, the management guru. It would certainly be constructive to have more attention and commentary on pet population estimates, not just in the USA, but around the globe.