
Feb 05, 2025 Dog Population in the USA
WellBeing News has periodically carried articles on global and US dog populations. For example, in the November 2020 Issue, we included an article summarizing several core findings from projects carried out by WellBeing International and others over the past ten years.
For example, we noted that domestic dogs are by far the most common canid on the planet (numbering somewhere between 800 million and one billion) but that, contrary to several claims in the literature, fewer than 50% of these dogs are free-roaming street dogs. Our analysis of dog populations worldwide concludes that approximately 60% of the global dog population lives in human homes and that humans also provide essential resources for homeless street dogs.
We have also proposed that dog populations should not be reported as dogs per unit area but as dogs per 1,000 humans. Dogs typically cluster around human homes. In addition, the metric number of dogs per 1,000 people has several valuable qualities. For example, the metric varies inversely with log human density – that is, in dense human communities, there are fewer dogs per 1,000 people than in rural and suburban communities. In addition, the number of dogs per 1,000 people metric varies linearly against log human density. The chart below uses data from surveys conducted by the American Veterinary Medical Association of the dog populations in the 48 states in the continental USA.
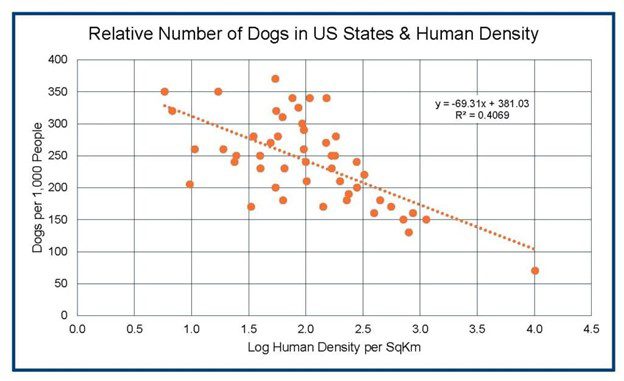
The trendline equation in this graph (Y = -69.31X + 381.03) can be used to predict the number of dogs in any of the 3,144 counties or any community in the United States as long as one knows the human density (in people per square kilometer) in the community. Any animal shelter could use this equation to predict, with reasonable accuracy, the number of pet dogs in the community they serve.
The inverse relationship between dogs per 1,000 people and log human density has been observed in dog surveys conducted in India, the Philippines, Mauritius, the UK, Afghanistan and Pakistan. Trendline equations from these surveys also represent the maximum dog population at low human densities. When human density is one person per square kilometer, the log human density is zero, and the trendline equation in the above chart simplifies to Y (dogs per 1,000 people) = 381.03. In other words, according to the trendline, the maximum dog population in the USA would be around 381 dogs per 1,000 people.
In India, dog population surveys have been conducted in different states and communities. The different trendline equations generated from these surveys indicate that the maximum dog population in India is between 250 and 300 dogs per 1,000 people. In Pakistan and Afghanistan, the trendline equations indicate that the maximum dog population is only around 40 dogs per 1,000 people. In Muslim countries, dogs tend to be regarded as haram (unclean), and they would be expected to have lower dog populations than in India or developed nations in the West.
A lack of change over time is another interesting characteristic of the dogs per 1,000 people metric. In the USA, pet population surveys indicate that there were around 215 dogs per 1,000 people in 1950. The dog population has increased only slightly since 1950 and now stands at around 239 dogs per 1,000. In Sweden, the dog population has varied between 80 and 90 dogs per 1,000 people since 1981, while, in the UK, the dog population has varied between 125 and 140 dogs per 1,000 people over the same period. The constancy of the value of the metric dogs per 1,000 people in these three countries is probably influenced by social factors, but nobody has studied what those factors may be.
Dog population surveys also produce varying projections of total dog populations depending on how the surveys are conducted. In the USA, surveys were typically conducted in the past using either telephone methods or household panel methods. Research indicated that the results produced by random digit dialing telephone methods produced results that were around 20% lower than the household panel surveys. Patronek and Rowan suggested in 1995 that this difference may have been caused by the households in pre-selected panels being more settled than those in the random-digit-dial surveys and, therefore, more likely to have acquired a pet. In the last decade, surveys have been conducted more often online. For some unexplained reason, online surveys produce higher estimates of pet populations than any of the other survey methods. In other words, consumers of data derived from pet population surveys should understand how a particular method might skew the announced results.
The periodic national census surveys conducted by the US Census Bureau and other national census agencies are the gold standard of population surveys. However, few national census agencies include questions on pets in their surveys. In the USA, over the past forty years, there have been several requests for the US Census to start asking about household pets in addition to the questions on refrigerators, telephones and television sets. However, the US Census Bureau always denied those requests. Then, in 2006, the PETS Act was passed following the Hurricane Katrina disaster. Many households affected by the hurricane and its aftermath were reluctant to evacuate because they could not take their pets. The Pets Act required communities and states to include pets in disaster plans. That development finally led to the US Census asking households how many pets they had in their regular National Housing Survey. The US Census Bureau asked about pets in 2013, 2017 and 2021. In 2013 and 2017, the survey asked households if they had any pets without asking about the type of pet, but in 2021, the Census Bureau asked households specifically if they had pet dogs and cats and, if so, how many.
The 2021 American Housing Survey reported that 49.6% of households had any pets, while 38% had dogs and 22% had cats. By comparison, the AVMA reported in 2022 that 45% of households had dogs and 26% had cats. The American Pet Products Association (APPA) reported in 2020 that 49.4% of households had dogs and 35.3% had cats. The APPA surveys of pet ownership have always been on the high side and are widely quoted in both academic papers and by animal NGOs. The 2021 National Housing Survey now provides a gold standard for how many households have pet dogs and cats.
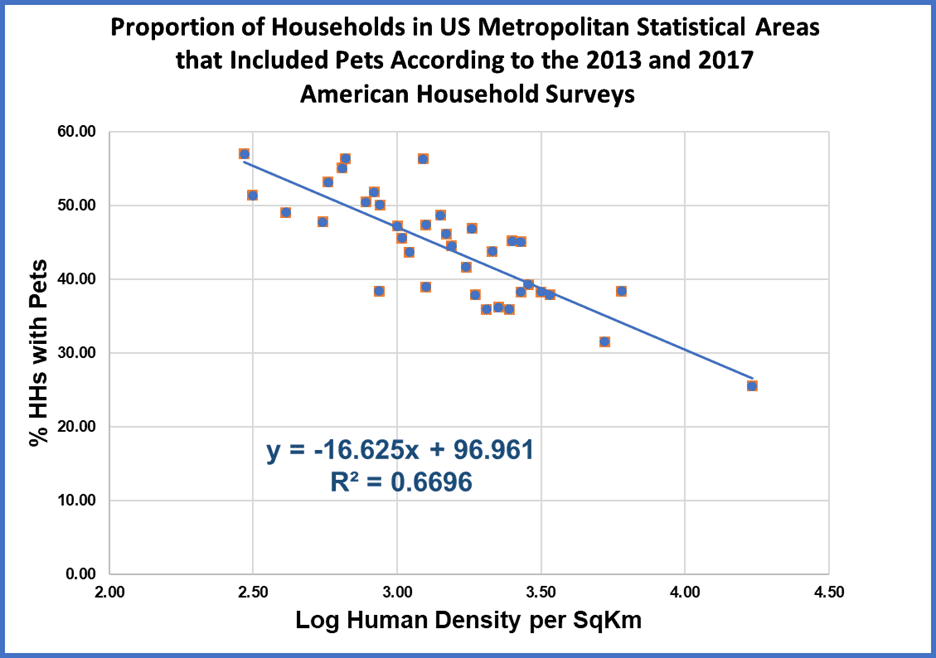 The 2021 data on pets has only recently become available for download using the US Census Table Creator. However, the pet ownership data from the 2013 and 2017 surveys have already demonstrated a clear relationship between pet ownership and human density (see chart). New York City is the data point on the right of the chart, where only around 25% of New York City households have pets. The data points for Oklahoma City and Tulsa are on the left, and over 50% of households in those less dense urban areas have pets.
The US Census data on pet dog and cat ownership now provides a welcome new set of data on US pet ownership that should help clarify national demographic details on who has pets.
Video credit: Kitreel, Shutterstock